

Build a process performance scorecard by putting a small set of established measures on one page, alongside their targets, comparable trends, evidence status, and accountable next responses. Each result should help someone decide whether to continue watching, check the evidence, investigate, or act within existing authority.
A report can contain accurate numbers and still leave all the useful interpretation in the founder’s head. Someone asks whether a late result matters. Someone else asks which spreadsheet is current. The founder explains it again. A usable scorecard makes enough of that context visible that the page can do its job without a running commentary.
Quick answer: what belongs on a process scorecard?
A process performance scorecard needs a defined process, a reporting period, a few decision-relevant measures, and a clear connection between each signal and a responsible person. Start with a shared document or spreadsheet; software is not the missing ingredient when nobody can explain what a number means.
The page should answer:
- What process and period are we looking at?
- What does each measure mean, and is its evidence current and comparable?
- How does the result compare with its target, guardrail, and recent history?
- What condition calls for attention, and who owns the next response?
This guide builds the scorecard artifact. If you do not yet have trustworthy definitions and observations, start with How to Measure a Business Process. Running the review meeting and investigating causes are separate jobs.
Give each row a decision to support
Begin with the measures you already use for one process. Beside each, finish this sentence: “We need this result to decide whether to ___.” A measure with no credible answer does not automatically deserve space on the main page.
For an invoice-processing team, accepted output might inform whether delivery commitments are being met. A quality measure protects against closing invoices quickly only to correct them later. Outstanding work keeps unfinished obligations visible. The right combination depends on the process; this is not a universal three-metric requirement.
Keep necessary compliance or contractual reporting even when it has no weekly operating decision. It can live in its required record rather than crowding the scorecard. Removing an unused display is different from deleting an obligation.
The Public Health Foundation, in John W. Moran’s Stages of Process Performance updated June 2024, connects timely, relevant measures with process-improvement decisions and identifies process owners who monitor performance and document changes. This is public-health quality-improvement guidance, not an SMB scorecard benchmark. The layout below is our practical application of evidence and accountability, not a template validated by that source.
How do you structure a one-page process performance scorecard?
Put shared context in a short header, recurring results in a compact table, and only the current response pointers beneath it. Link to detailed definitions and case records instead of copying them onto every reporting page.
Header: make the scope unmistakable
Include the process boundary, observation period, refresh timestamp, scorecard owner, and next update/review date. Name the authoritative source and the definition version where these apply to every row.
“Invoice approval, received to accepted for payment, week ending September 18” is more useful than “Finance KPIs.” It identifies the work and the slice of time being shown. Payment itself is outside that example boundary.
The data updater maintains the numbers. The process owner is accountable for the process. The response owner takes the named next step when a signal needs attention. One person may hold these roles in a small team, but the labels should not silently mean three different things. If the mandate itself is unclear, use What Is a Process Owner? before assigning responsibility through a table.
Results: a reusable layout
Copy this structure and replace the prompts with your existing measures. Combine columns only when the meaning remains readable.
| Measure and definition reference | Evidence and period | Current result and recent history | Target or guardrail | Attention rule | Response owner and next step |
|---|---|---|---|---|---|
| Name; definition/version link; unit | Source; updater; freshness/comparability state | Current value; denominators where relevant; dated comparable values | Approved level and its basis | Exact condition that needs attention | Person; bounded response; due point/action reference |
A compact row does not need to repeat a long formula. It does need to resolve to one. When a label such as “cycle time” has several interpretations, the time-measure comparison helps settle the definition before it enters the scorecard.
Keep case-level detail in the controlled source record. The scorecard links to that evidence; it should not expose customer or employee information to every reader simply because the underlying system holds it.
Response pointers: enough to know what happens next
For an active signal, add a short pointer such as “Mira: check unresolved approval cases by Monday noon; action A17.” That tells the reader who is doing what and where the outcome belongs. It does not require a second action-tracking system embedded in the scorecard.
A dashboard that sends an alert to the founder has transmitted information. It has not established who will resolve the issue.
Keep targets, guardrails, and triggers separate
A baseline describes observed performance. A target states a desired result. A guardrail protects a condition that should not be sacrificed to reach that target. A trigger specifies when a person needs to respond.
For example, “40 accepted invoices per week” might be a locally agreed output target. “No invoice released without required approval” is a guardrail. “Any suspected approval omission requires the finance lead’s immediate review under the existing incident procedure” is a response trigger.
Those statements do different work. A good output total cannot cancel a guardrail breach. Nor does missing an output target prove that someone worked too slowly.
Thresholds should have a recorded basis: an existing customer commitment, a risk boundary, a capacity agreement, or an explicitly provisional operating choice. The accountable owner approves the rule and its review date. Do not copy an arbitrary red/amber/green percentage range from a dashboard template and call it a standard.
An attention rule is also not a statistical control limit. A short run of values can show what happened without proving a stable trend or a special cause. If statistical monitoring is required, the chosen method and data requirements need separate treatment.
Worked example: an invoice approval scorecard
The following numbers, people, and rules are illustrative, not client results or industry benchmarks. Assume the definitions and source records have already been validated. The example team has locally agreed these rules for its current commitments.
Scope: invoice receipt to acceptance for payment; standard invoices only.
Current period: September 14–18, 2026; refreshed September 21 at 09:00. All times use the example team’s local office time.
Shared source: controlled invoice register, definitions v1; updater: Noor.
Process owner: Mira, finance lead. Next refresh/review: September 28, 2026.
History order: Monday–Friday periods ending September 4, 11, and 18, 2026, from Monday 00:00 through Friday 23:59. The open-work snapshots are the following Mondays, September 7, 14, and 21 at 09:00. Exceptional invoices have a separate linked record and are not silently discarded.
For this illustration, acceptance means the required checks and approval are complete and recorded. Output counts each standard invoice once, in its first-acceptance week. The correction row counts members of that same cohort returned at least once before first acceptance, also once per invoice, with observation closing at first acceptance. Later returns remain in a separate exception record and cannot create another first acceptance.
Open work includes received invoices not yet first accepted, including those awaiting correction. Its age runs from initial receipt without resetting on return. The local example allowance expires at 17:00 on the fifth Monday–Friday date after receipt; receipt day is excluded, with no holiday exclusions in this illustrative calendar. The overdue row counts open items past that deadline at the stated snapshot. This is a historical September 21 illustration; its dated actions are not live instructions.
| Measure | Three comparable weeks | Locally agreed rule | Current meaning and response |
|---|---|---|---|
| Accepted invoices, count | 39 / 42 / 38 | Target 40 weekly; below 40 prompts a commitment check | Below target. Mira checks outstanding commitments by September 21 noon; A17. No staffing conclusion implied. |
| Invoices returned before first acceptance, count out of the accepted cohort | 2 of 39 / 1 of 42 / 4 of 38 | More than 2 prompts review of the affected records | Attention required. Arun checks the four returns by September 22 at 17:00; A18. Output does not cancel this signal. |
| Open overdue invoices, following-Monday snapshots | 3 / 2 / 5 | Any overdue invoice needs a named follow-up | Five open obligations. Mira verifies named follow-ups by September 21 noon; A19. These are not part of a completed-only time average. |
These are three observations, not proof that the process has deteriorated. The page does establish which rules were met, which need attention, and who checks next. It does not explain why invoices were returned or establish a bottleneck.
Output, occupation, and available capacity also answer different questions. If a reader interprets a busy team as evidence that its output must be adequate, delegate that comparison to Throughput vs Capacity vs Utilization.
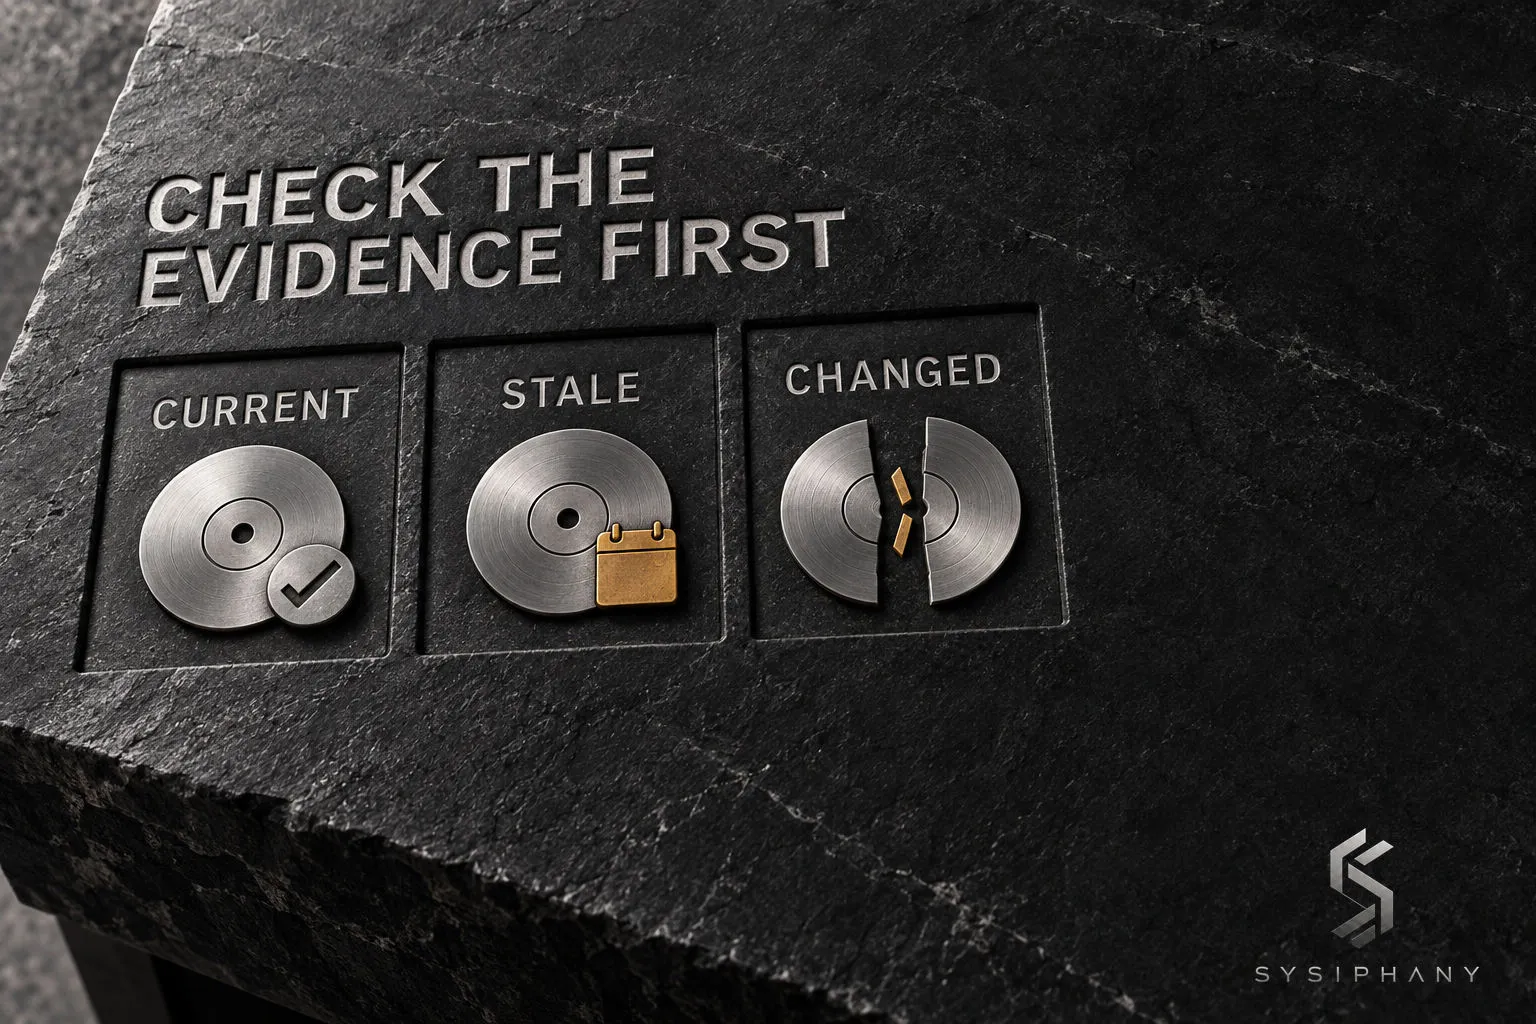
Make invalid evidence visible before assigning performance status
A stale value is not a current pass. If the September 21 refresh fails, the prior result may remain visible as history, but the current result must say stale. Noor owns restoring the extract by a named due time; until then, Mira treats current performance as unverified.
Distinguish three situations:
| Evidence condition | What the scorecard should show | Appropriate response |
|---|---|---|
| Missing or stale | Current status unknown; last valid date visible | Repair or confirm the evidence; avoid a fresh pass label |
| Definition or population changed | Break in comparability; old and new series identified | Mark the change and review comparisons before drawing a trend |
| Valid result crosses an attention rule | Actual value, rule, owner, response pointer | Check or act within the agreed authority; investigate cause separately |
For instance, adding exceptional invoices to the standard-invoice row changes the population. Preserve the previous definition and mark the first period using the new one. Do not join the two series into an apparently continuous improvement line.
A disagreement between tools needs an authoritative source decision, not an average of conflicting values. Source-of-truth governance owns that problem. On this page, identify the disputed field and its evidence owner rather than displaying a confident status.
Test whether the page earns its upkeep
Try the scorecard for two review cycles as a usability check, not statistical validation of the process. Ask a colleague who did not build it to explain one flagged row: its period, meaning, evidence limitation, trigger, and next responsible person. Anything they must guess is a design defect worth fixing.
Time the update work. If maintaining a measure takes substantial manual reconstruction, check whether the decision it supports justifies that effort. The answer may be a clearer source link or fewer displayed measures rather than a new dashboard.
After the trial, retain useful rows, simplify confusing ones, and remove displays nobody uses while preserving required reporting records. Keep this exercise about the scorecard. A full review agenda, causal investigation, or process-change experiment needs its own operating method.
If creating the page exposes unresolved ownership and conflicting records, Download the Operational Drag Diagnostic Kit to examine the friction underneath the reporting.
Frequently asked questions
Is a process scorecard the same as a Balanced Scorecard?
No. This process scorecard monitors one defined flow of work and its next responses. A Balanced Scorecard addresses broader organizational strategy through multiple perspectives. Do not turn a local operating page into a company-wide strategy framework unless that is the actual task.
Should every measure have a red, amber, or green status?
No. Plain status text can be clearer, especially when evidence is missing or incomparable. If color is used, pair it with a written meaning and a documented rule. Never let a satisfactory-looking color hide an outdated result or a breached guardrail.
Can we combine all the measures into one overall score?
Only if the weighting has a defensible decision purpose and preserves non-negotiable guardrails. For a first operating scorecard, keep separate signals visible. An average can conceal a serious quality problem behind strong output.
Can AI write the scorecard commentary?
AI can draft a summary from approved records, but a named person still verifies factual statements, evidence limitations, and any proposed response. Missing data should stay missing, not become a plausible explanation. Deterministic calculations are preferable where the rule is already clear.
What if the scorecard is clear but nobody has authority to respond?
That is an authority problem, not a display problem. Keep the blocked response visible and resolve the decision boundary through Decision Rights for Small Business. Do not make the founder the automatic owner of every unresolved signal.
A useful scorecard lets another person understand the evidence and the next responsibility without reconstructing the founder’s private context. Start with one process and a page someone can maintain.
When that work reveals cross-team authority conflicts or competing systems of record, Book a SYSIPHANY discovery call.